onViewClick
onViewClick allows developers to call a function when dashboard charts have been clicked.
Supported views:
- Column Chart
- Horizontal Bar Chart
- Pie Charts
- Basic Table
- Pivot Table
When a user clicks on a chart bar, pie segment, or table cell, a function with the onViewClick parameters will be triggered featuring dynamic data.
<Vizzly.Dashboard
  // ...
  onViewClick={(data, loadUnderlyingData) => {
    console.log("Click event data", data)

    const { viewId, type, fields, fieldsV2, clicked } = data;
    // fields and fieldsV2 only available for Basic Table and Pivot Table click events

    if (data.viewId === 'view_c0d9b923-8e28-4eef-89a5-cb8dc0fad092') {
      if (data.type === 'basicTable') {
        // Navigate to a page based on a clicked table cell

        const categorySlug = data.fields['fie_category_slug'];
        const productSlug = data.fields['fie_product_slug'];

        window.location.href = `https://www.yoursite.com/${categorySlug}/${productSlug}/`;
      }
    }
  }}
/>
onViewClick Parameters
data
type OnViewClick = {
  // A persisted id for the view.
  viewId: string;
  // Avaiable view types.
  type: 'barChart' | 'horizontalBarChart' | 'dataTable' | 'basicTable' | 'pieChart';
  // Returns the information related to the element clicked on.
  fields: {
    [key: string]: string | number;
  }
  fieldsV2: { [key: string]: string | number }[];
  clicked: {
    // Available on certain view configurations.
    grouping: [{
      fieldId: string;
      function: string;
      value: string | number;
    }]
    // Specific information about the element clicked on
    value: {
      fieldId: string;
      function: string;
      value: string | number;
    }
  }
}
loadUnderlyingData
Use loadUnderlyingData to run an additional query against your Vizzly dataset based on dynamic data in a clicked bar or pie segment.
Supported views:
- Column Chart
- Horizontal Bar Chart
- Pie Charts
import Vizzly from "@vizzly/dashboard";

export type QueryAttributes = {
  measure: {
    field: string;
    function: string | "none";
  }[];
  dimension: {
    field: string;
    function: string;
    pivot?: "x" | "y";
  }[];
  order: {
    direction: "asc" | "desc";
    field: string;
    function: string | "none";
  }[];
  timeDimension: {
    field: string;
    truncate: string;
    timeZone?: string;
    bucketFill?: boolean;
  } | null;
  limit?: number;
  offset?: number;
  filter: {
    field: string;
    op: string;
    value: any;
    function?: string;
  }[][];
};

export type QueryResponse = {
  results: (Result | null)[] | (any[][] | null)[] | null;
};

export type Result = {
  content: any[][];
  fields: {
    id: string;
    publicName: string;
    dataType: "number" | "boolean" | "string" | "date_time" | "string[]";
    hidden?: boolean;
  }[];
};

export function Dashboard() {
  return (
    <Vizzly.Dashboard
      // ...
      onViewClick={async (data, loadUnderlyingData) => {
        console.log("Click event data", data);

        const { viewId, type, clicked } = data;

        const clickedCountry = clicked?.[0]?.value;

        if (
          viewId === "85639a2f2f2b860_3_0" &&
          type === "barChart" &&
          loadUnderlyingData
        ) {
          try {
            // loadUnderlyingData only available for Column Charts, Horizontal Bar Charts, and Pie Chart click events
            const queryAttributes: Partial<QueryAttributes> = {
              measure: [{ field: "fie_customer", function: "count" }],
              dimension: [
                {
                  field: "fie_city",
                  function: "none",
                  pivot: "x",
                },
              ],
              filter: [
                [
                  {
                    op: "=",
                    value: clickedCountry,
                    field: "fie_country",
                  },
                ],
              ],
            };

            // Query any field in your dataset using the fieldId's
            const response: QueryResponse =
              await loadUnderlyingData(queryAttributes);

            console.log("Query results:", response);
          } catch (error) {
            console.error("Query error:", error);
          }
        }
      }}
    />
  );
}
Querying Data
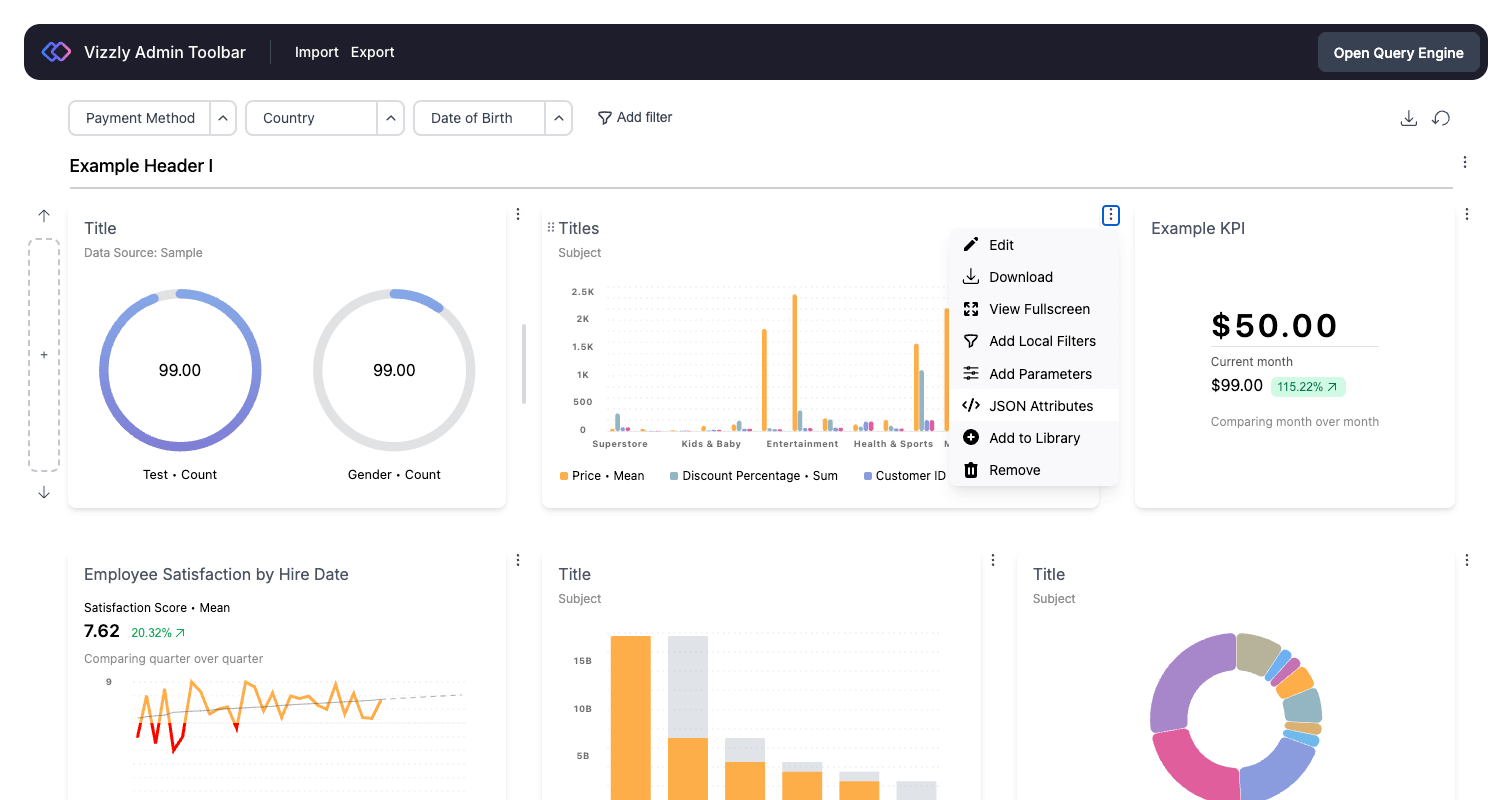
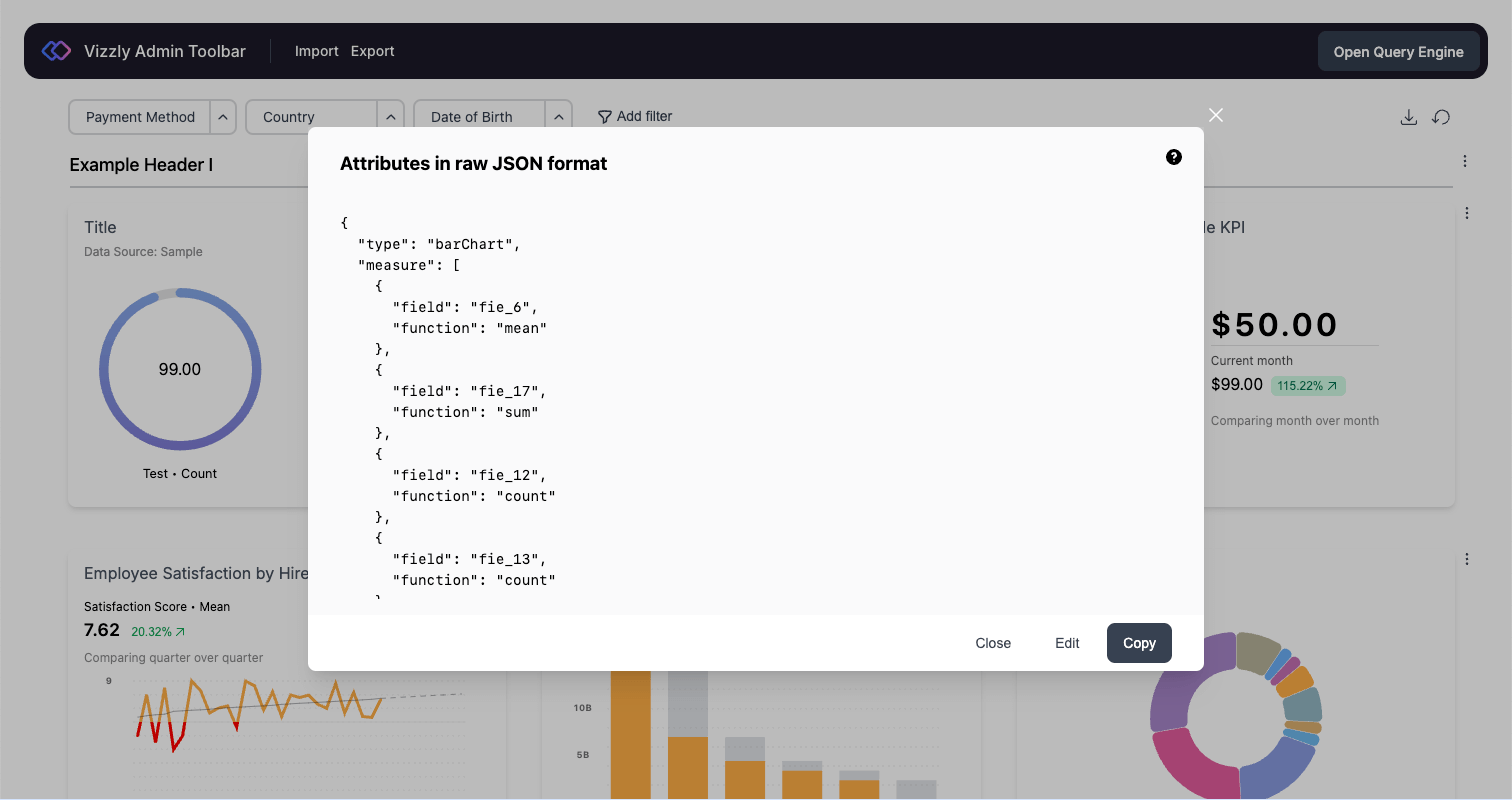
loadUnderlyingData involves querying data against your Vizzly dataset. To learn more about the measure, dimension, order, timeDimension, and filter attributes you'd like to query, recommend using the developerTools property viewRawAttributes.
viewRawAttributes will allow you set up a <Vizzly.Dashboard /> chart and view the underlying attributes so you can replicate this in a loadUnderlyingData query.